Triple Exponential Moving Average TEMA Definition and Formula

Triple Exponential Moving Average (TEMA): Definition and Formula
The triple exponential moving average (TEMA) is a trend-following indicator designed to smooth price fluctuations and identify trends without lag. It achieves this by taking multiple exponential moving averages (EMA) of the original EMA and subtracting out lag.
The TEMA can be used like other MAs to identify trend direction, signal potential short-term trend changes or pullbacks, and provide support or resistance. It can be compared with the double exponential moving average (DEMA).
Key Takeaways:
– TEMA uses multiple EMA calculations to create a trend-following indicator that reacts quickly to price changes.
– TEMA helps identify trend direction, signal potential short-term trend changes or pullbacks, and provide support or resistance.
– TEMA confirms an uptrend when the price is above it and confirms a downtrend when the price is below it.
Formula and Calculation for TEMA:
TEMA = (3 * EMA1) – (3 * EMA2) + EMA3
where:
EMA1 = Exponential Moving Average (EMA)
EMA2 = EMA of EMA1
EMA3 = EMA of EMA2
To calculate the TEMA:
1. Choose a lookback period.
2. Calculate the EMA for the lookback period (EMA1).
3. Calculate the EMA of EMA1 using the same lookback period (EMA2).
4. Calculate the EMA of EMA2 using the same lookback period.
5. Plug EMA1, EMA2, and EMA3 into the TEMA formula.
What Does the TEMA Tell You?
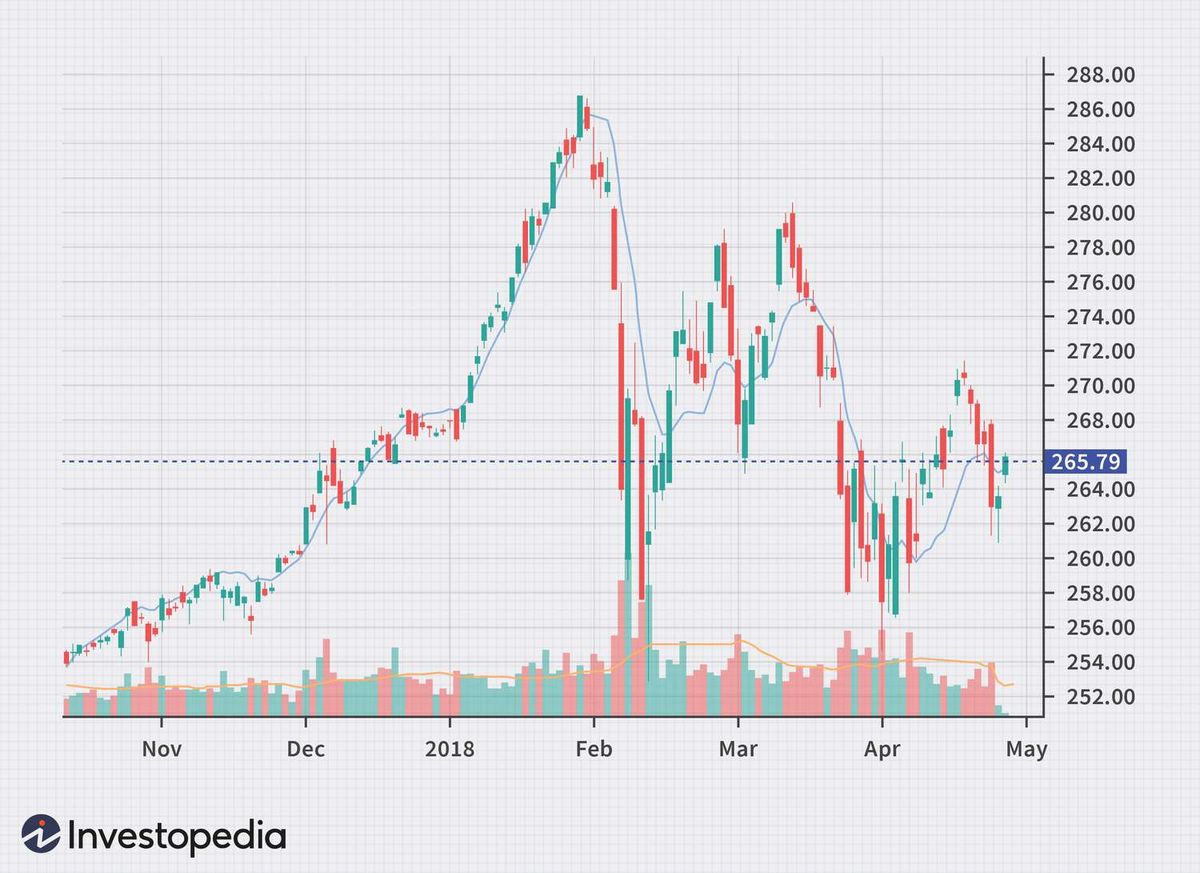
The TEMA reacts to price changes quicker than traditional MAs or EMAs due to reduced lag. The angle of the TEMA indicates the short-term (averaged) price direction. When the line is sloping up, the price is moving up, and when it’s angled down, the price is moving down. However, there may still be some lag in the indicator, especially with larger lookback periods.
The TEMA and Trend Direction:
The location of the TEMA relative to the price confirms trend direction. When the price is above the TEMA, it confirms a rising price for that lookback period. When the price is below the TEMA, it confirms a falling price for that lookback period. The appropriate lookback period should be chosen for the asset being traded to ensure accuracy.
The TEMA for Support and Resistance:
The TEMA may also provide support or resistance for the price. In an overall rising price, the price may drop to the TEMA on pullbacks and then bounce off it, continuing to rise. This movement depends on the correct lookback period for the asset.
The TEMA vs. the Double Exponential Moving Average (DEMA):
TEMA and DEMA both reduce lag in average-based indicators, but TEMA reduces lag more than DEMA. The formula for DEMA is different, providing slightly different information and signals.
Limitations of Using the TEMA:
Though TEMA reduces lag, it still inherits some traditional MA problems. It is primarily useful in trending markets, and during choppy times, it may provide little insight and generate false signals. Traders have different preferences regarding lag and reactiveness, so choosing the appropriate MA comes down to personal preference and trading strategy.
The TEMA is best utilized in conjunction with other forms of analysis, such as price action analysis, other technical indicators, and fundamental analysis.
Example of the TEMA:
Here’s an example of the TEMA applied to the SPDR S&P 500 ETF. The TEMA smoothes out price action and helps identify the overall trend direction amidst minor price fluctuations.


