Volatility Skew How it Can Signal Market Sentiment

Contents
- 1 Volatility Skew: Signal of Market Sentiment
- 1.1 Why Does Volatility Skew Occur?
- 1.2 Interpreting Volatility Skew
- 1.3 Determining Abnormal Volatility
- 1.4 The Formation of a Volatility Smirk
- 1.5 The Implications of a Volatility Smirk
- 1.6 The Benefits and Limitations of Analyzing Volatility
- 1.7 The Benefits of Analyzing Volatility
- 1.8 What is Implied Volatility?
- 1.9 What are the Key Differences between a Volatility Skew and a Volatility Smile?
- 1.10 What is the Key Difference between a Reverse and Forward Skew?
- 1.11 What are the Common Underlying Securities when Analyzing Volatility?
- 1.12 Are there other ways to Analyze Volatility?
- 1.13 The Bottom Line
Volatility Skew: Signal of Market Sentiment
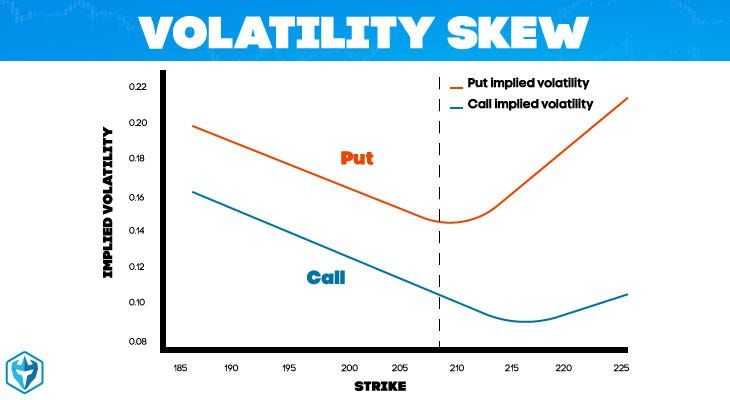
The volatility skew is the difference in implied volatility (IV) among out of the money options (OTM), at the money options (ATM), and in the money options (ITM). It is influenced by sentiment and the supply and demand relationship of specific options in the market. The volatility skew reveals whether traders and investors prefer writing calls or puts.
Also called vertical skew, traders can use relative changes in skew for an options series as a trading strategy.
Key Takeaways
- Volatility skew describes the variation in implied volatility assigned to options on the same underlying security and expiration in the market.
- For stock options, skew indicates that implied volatility is higher for downside strikes compared to upside strikes.
- Some underlying assets show a convex "smile" in volatility, indicating more demand for ITM or OTM options than ATM options.
Why Does Volatility Skew Occur?
Volatility skew arises from the difference in implied volatility (IV) levels among options with different strike prices but the same expiration date. IV measures the expected movement in the price of the underlying asset.
The primary driver of volatility skew is collective expectations and behavior among market participants. If investors anticipate a significant price movement in one direction, they may be willing to pay a higher premium for options that would profit from that move. This increased demand pushes up the IV of those options, resulting in skew.
Additionally, investors often view downside risk (possibility of prices falling) as greater than upside potential, especially in equity markets. This is because stock prices have a limit of zero, while there is theoretically no limit to how high they can go. Consequently, investors are typically more willing to pay a higher premium for put options that rise in value when prices fall, compared to call options that rise when prices rise. This preference can lead to higher IV for OTM put options, creating volatility skew.
Furthermore, specific market events such as earnings announcements or economic reports can create temporary volatility skew if investors anticipate significant price movements. They may be willing to pay more for options that would benefit from those movements. After the event, the skew typically disappears.
Notably, major market downturns or financial crises can also generate volatility skews. For example, the 1987 stock market crash caused a significant skew as investors rushed to buy put options for protection against further declines.
The shape of the volatility skew can provide valuable information about market expectations and potential future price movements. However, it is important to remember that these are only expectations, and actual future price movements may differ.
Implied volatility values are often computed using the Black-Scholes option pricing model or modified versions of it.
Interpreting Volatility Skew
Interpreting volatility skew involves understanding the implications of its shape and slope. Some interpretations include:
- Positive or Forward Skew: A positive skew indicates that OTM call options have higher implied volatility than OTM put options. This is commonly seen in commodity markets, where sudden demand spikes drive significant price increases. A positive skew suggests the market expects an upward price movement.
- Negative or Reverse Skew: A negative skew means OTM put options have higher implied volatility than OTM call options. This is frequently observed in equity markets where investors are more concerned about price declines and are willing to pay more for put options to protect their investments. A negative skew indicates the market expects a downward price movement.
- Smile: A volatility smile occurs when both OTM call and put options have higher implied volatility compared to ATM options. It indicates high uncertainty or an expectation of large price movements in either direction.
- Flat or No Skew: No skew means IV is the same for all options, regardless of strike price. This suggests that the market does not anticipate significant movements in either direction.
It is important for traders and investors to continuously monitor the volatility skew and adjust their strategies accordingly, as market expectations can change over time. The skew should also be used alongside other market indicators.
Determining Abnormal Volatility
A volatility skew can help identify abnormal volatility in the market. A significant change in the volatility skew may indicate abnormal volatility. For instance, if the skew becomes more negative, meaning IV of OTM put options increases relative to call options, it could suggest investors expect a significant downward price movement accompanied by increased volatility.
Comparing the current volatility skew to its historical levels allows traders and investors to assess whether the current market expectations reflected in the skew are abnormal. If the skew significantly deviates from its historical average, it could indicate the market expects abnormal volatility.
A volatility smile, where IV is higher for both OTM and ITM options compared to ATM options, also indicates the market expects large price movements in either direction, implying abnormal volatility.
Additionally, a steep skew, where implied volatility varies significantly across different strike prices, can signal abnormal volatility.
While volatility skew provides valuable insights into market expectations, it should not be analyzed in isolation. Other factors such as market news, economic indicators, and technical analysis tools should be considered to assess the likelihood of abnormal volatility.
The Formation of a Volatility Smile
A volatility smile occurs when IV for options on a particular security or market index increases as the options move further ITM or OTM, with the lowest IV point generally at the ATM strike. The pattern is often depicted as a V-shaped curve.
The Implications of a Volatility Smile
A volatility smile has several important implications for options pricing and market expectations:
- Market Expectations: The volatility smile reflects market expectations of future price movements. A steep smile, with higher IVs for ITM and OTM options compared to ATM options, suggests anticipations of large price movements.
- Pricing of Options: The volatility smile affects options pricing. Options with strike prices in the wings of the smile (far ITM or OTM) have higher IVs and therefore higher prices compared to a flat IV curve across all strike prices.
- Risk Assessment: The shape of the volatility smile provides information about perceived market risk. A steep smile might suggest a higher risk of large price movements.
- Arbitrage Opportunities: Ideally, options on the same underlying asset with the same expiration date but different strike prices should have the same IV. If this is not the case, as indicated by the volatility smile, potential arbitrage opportunities may arise. Nevertheless, exploiting these opportunities can be challenging in practice due to transaction costs and other market frictions.
- Jump Risk: A pronounced volatility smile can indicate expectations of "jump risk," which refers to the risk of sudden large price movements. This could be due to upcoming events like earnings announcements, economic reports, or other market-moving news.
- Limitations of Black-Scholes Model: The existence of a volatility smile highlights the limitations of the Black-Scholes model for options pricing. The model assumes constant volatility that does not change with the strike price, which does not hold in the real world.
The Formation of a Volatility Smirk
A volatility smirk occurs when IV for options on a security or index decreases as the options become more ITM or OTM. The pattern is often depicted as a curve sloping downward, resembling a smirk.
The Implications of a Volatility Smirk
A volatility smirk has several implications for options pricing, market expectations, and risk management:
- Market Expectations: The volatility smirk reflects market expectations of future price movements. A steep smirk, with higher IV for OTM put options compared to ATM or ITM options, suggests expectations of a significant downward price movement.
- Pricing of Options: Options with strike prices in the tail of the smirk (far OTM) have higher IVs and therefore higher prices compared to a flat IV curve.
- Risk Assessment: The shape of the volatility smirk provides information about perceived market risk. A steep smirk might suggest a higher risk of large price movements, particularly to the downside.
- Arbitrage Opportunities: Like the volatility smile, a volatility smirk that deviates from the expected IV can create arbitrage opportunities. However, exploiting them can be challenging due to transaction costs and market frictions.
- Jump Risk: A pronounced volatility smirk can indicate expectations of "jump risk," similar to a volatility smile. This could result from upcoming events like earnings announcements, economic reports, or other market-moving news.
- Limitations of Black-Scholes Model: The existence of a volatility smirk suggests that the Black-Scholes model, which assumes constant volatility, has limitations for pricing options in the real world.
The Benefits and Limitations of Analyzing Volatility
Analyzing volatility in financial markets provides several benefits, but it also has limitations.
The Benefits of Analyzing Volatility
Volatility is a key measure of risk in financial markets. Higher volatility generally indicates higher risk, as it implies larger potential price swings. This helps investors assess the riskiness of different assets or portfolios.
Moreover, by understanding the volatility of different assets, investors can diversify their portfolios more effectively. Assets with low correlation and different volatility levels offer diversification benefits. Volatility plays a crucial role in pricing derivatives like options, where higher volatility leads to higher option prices.
Furthermore, changes in volatility can provide insights into market sentiment. Rising volatility may indicate increasing uncertainty or fear among market participants. Traders and investors use volatility to inform their investment strategies, employing approaches like straddles or strangles in high-volatility environments.
The Limitations of Analyzing Volatility
Limitations of analyzing volatility include the calculation process, volatility stability, normal distribution assumption, volatility clustering, and lack of directional information.
Historical volatility, calculated from past price changes, may not accurately predict future volatility. Implied volatility, derived from option prices, provides a forward-looking estimate but is based on market participants’ expectations, which may not always be accurate.
Volatility itself can be volatile, quickly changing in response to market events, making it difficult to predict. Additionally, many volatility models assume price changes follow a normal distribution, but financial returns often exhibit skewness and kurtosis, indicating asymmetric and fat-tailed distributions.
Volatility clustering is another phenomenon observed in financial markets, where low volatility periods are followed by high volatility periods, and vice versa. This complicates analysis.
Finally, while volatility measures the magnitude of price changes, it does not provide information about the direction of the change. High volatility can imply large price increases, decreases, or a mix of both.
What is Implied Volatility?
Implied volatility is a metric that reflects the market’s expectations of future volatility in a security’s price.
What are the Key Differences between a Volatility Skew and a Volatility Smile?
While both volatility skew and volatility smile are patterns related to the IV across different strike prices, they represent different market expectations and conditions. The volatility skew typically indicates a greater fear of downside risk, while the smile suggests a higher likelihood of large price moves in either direction.
What is the Key Difference between a Reverse and Forward Skew?
The key difference between a reverse skew and a forward skew lies in their direction. A reverse skew indicates a market expectation of a large downward move, characterized by higher IV for lower strike prices. A forward skew suggests a market expectation of a large upward move, reflected in higher IV for higher strike prices.
What are the Common Underlying Securities when Analyzing Volatility?
Volatility analysis applies to a wide range of securities, including equities, equity indices, options, futures, foreign exchange (FX), bonds, exchange-traded funds (ETFs), and mutual funds.
Are there other ways to Analyze Volatility?
Other methods for analyzing volatility include historical volatility, volatility indices, generalized autoregressive conditional heteroskedasticity (GARCH) models, volatility term structure, volatility surface, and the average true range (ATR).
The Bottom Line
Analyzing volatility provides insights into market sentiment and potential price movements, aiding in risk management and trading strategy development. It can be analyzed through various methods, but none can perfectly predict future volatility. These methods should be used as tools to inform decision-making, rather than definitive predictors. Limitations of volatility analysis pertain to its basis on past data and market sentiment, which may not accurately predict future market conditions. Additionally, high volatility can indicate higher risk, which may not suit all investors.


