Valuation Mortality Table What It is How It Works

Contents
- 1 Valuation Mortality Table: What It is and How It Works
- 1.1 What is a Valuation Mortality Table?
- 1.2 Understanding Valuation Mortality Table
- 1.3 How Mortality Tables Work
- 1.4 Example of Valuation Mortality Table
- 1.5 What benefits does knowing my actuarial age provide?
- 1.6 How often are mortality tables updated?
- 1.7 What is a normal mortality rate?
- 1.8 The Bottom Line
Valuation Mortality Table: What It is and How It Works
What is a Valuation Mortality Table?
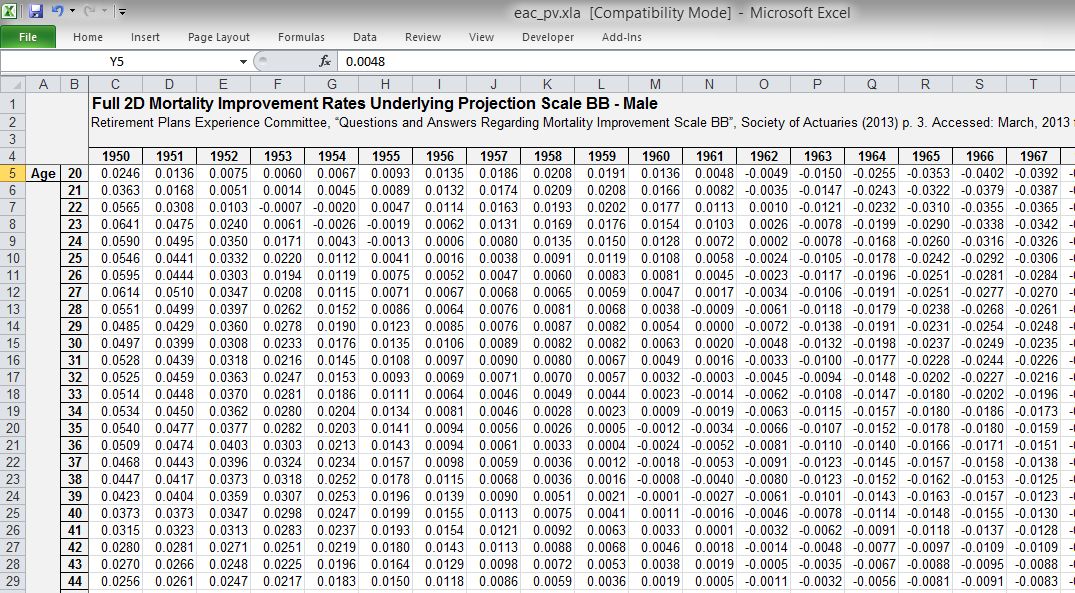
A valuation mortality table is a statistical chart used by insurance companies to calculate the statutory reserve and cash surrender values of life insurance policies.
A mortality table shows the death rate at any given age based on the number of deaths for every thousand individuals of that age. It provides statistics indicating the likelihood that a person of a given age will live a set number of years. Insurance companies use this information to assess risks in policies and set premiums.
Key Takeaways
- A valuation mortality table is a statistical chart used by insurance companies to calculate the death rate for people at different ages.
- Insurance companies use this table to set reserves for claims, benefits, and cash surrender value of life insurance policies.
- The tables integrate a cushion to protect insurers from going bankrupt.
- Algorithms to calculate actuarial age use a mix of factors, including age and family health history.
Understanding Valuation Mortality Table
Life insurance companies use valuation mortality tables to determine their legal reserve: the amount of liquid assets required by law for claims and benefits. The National Association of Insurance Commissioners (NAIC) sets minimum reserve requirements and periodically updates the guidance.
A valuation mortality table typically includes a safety margin to protect insurers. Regulators often require the use of safety margins. Insurers may also apply their own additional margins, which vary for different types of insurance policies and annuities.
The safety margin provides a buffer in case more people pass away than expected, leading to more claims having to be paid out. Without a reserve, an insurance company could go bankrupt.
How Mortality Tables Work
Section 7520 of the Internal Revenue Code requires the use of actuarial tables to value annuities, life estates, remainders, and reversions. The Commissioners Standard Ordinary (CSO) mortality table, prepared by the NAIC in conjunction with the Society of Actuaries (SOA), is used for life insurance ages across all 50 states and the District of Columbia.
Mortality tables determine actuarial life expectancy, which is an average statistic. Insurers use this information to set insurance premiums and payouts.
The CSO/SOA tables were last updated in 2017, adding significantly more data than the previous 2001 tables. The new tables’ lower mortality rates reflect longer longevity among Americans. By 2020, all insurance companies were required to transition to the 2017 CSO table for new products sold.
Example of Valuation Mortality Table
For example, a male non-smoker buying a $100,000 life insurance policy at age 40 may be estimated to live, on average, until age 81. The insurer sets a premium based on this mortality prediction and the future payout.
Individual results don’t matter much to insurers since they sell thousands of policies each year. They count on the large number of policies to track the mortality average on which premiums are based.
Actuaries consider various factors, including high blood pressure, cholesterol, family history, and current health, to assess longevity. The major factors affecting longevity are age, gender, tobacco product use, and health.
A longer expected longevity means lower life insurance premiums since the insurer predicts more total premiums paid.
What benefits does knowing my actuarial age provide?
Consumers can use online calculators to estimate their actuarial age, which can be useful for pricing insurance policies and financial planning. It can also help with decisions like when to begin collecting Social Security and how many years of income are needed in retirement.
How often are mortality tables updated?
The IRS updates its actuarial tables every 10 years. The current table, based on 2010 data, became effective in May 2023. The NAIC and SOA update their tables less frequently, transitioning from 2001 to 2017 CSO tables for new products sold.
What is a normal mortality rate?
In the United States, the 2021 mortality rate was 835.4 deaths per 100,000 people, resulting in an average life expectancy of 76.1 years. However, expected mortality changes as people get older. The life expectancy for a 65-year-old was 83.4 years in 2021.
The Bottom Line
Valuation mortality tables are tools used by insurance companies to calculate values for designing and pricing insurance products. By understanding mortality rates, individuals can make informed financial, insurance, and retirement planning decisions.


