Understanding the BCG Growth Share Matrix and How to Use It

Understanding the BCG Growth-Share Matrix
The BCG growth-share matrix is a planning tool that helps companies decide what products to keep, sell, or invest in. It uses graphical representations of a company’s offerings, plotting them on a four-square matrix based on market growth and market share. Introduced by the Boston Consulting Group in 1970, the matrix aids in prioritizing business activities.
Key Takeaways:
– The BCG growth-share matrix is a management tool for assessing a firm’s units or product lines.
– BCG stands for the Boston Consulting Group, a respected consulting firm.
– The matrix helps companies decide which products to keep, sell, or invest more in.
– It categorizes products into dogs, cash cows, stars, and question marks.
– The matrix is not predictive and does not account for new products or shifts in demand.
Understanding a BCG Growth-Share Matrix
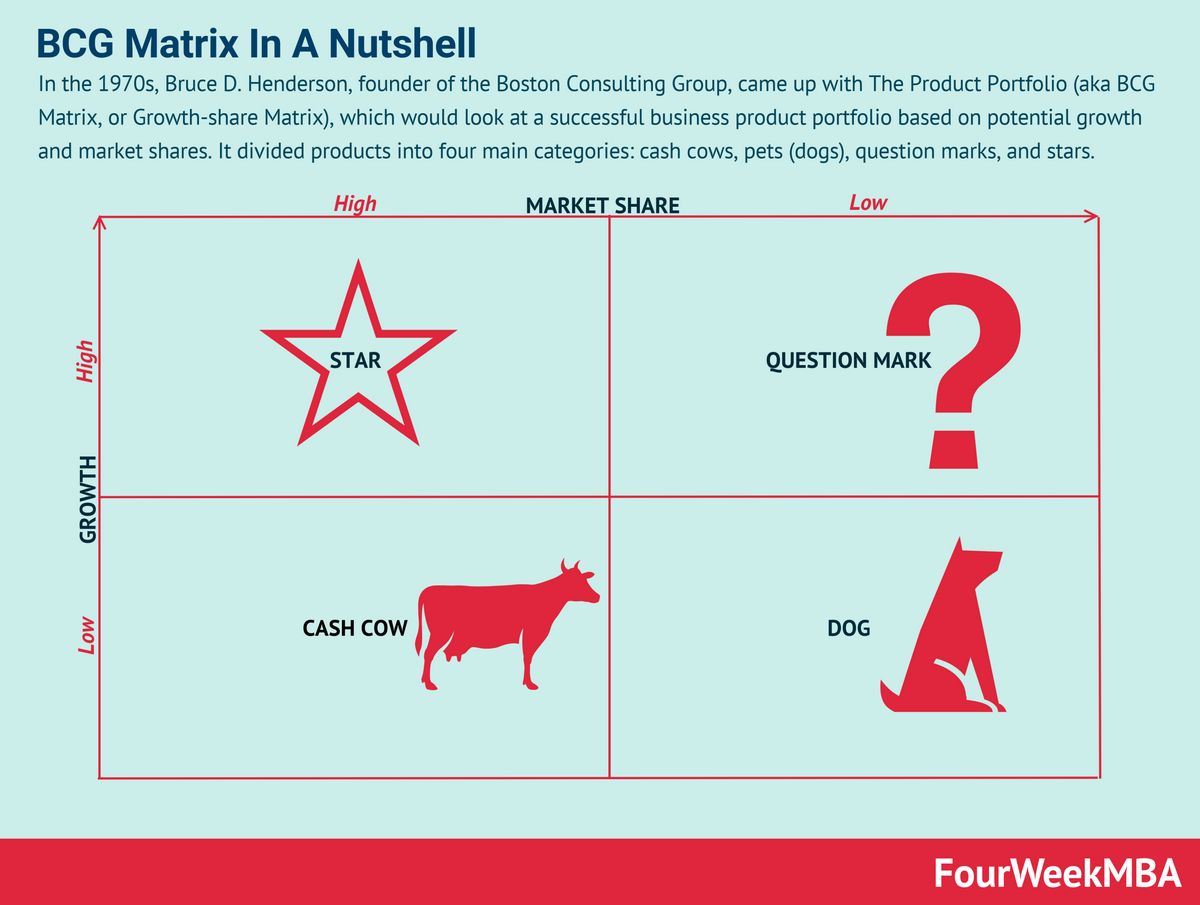
The BCG growth-share matrix categorizes products as dogs, cash cows, stars, or question marks. Dogs have low market share and growth and should be sold, liquidated, or repositioned. Cash cows have low growth but a large market share and should be milked for cash. Stars are in high-growth markets and require investment. Question marks are in high-growth markets but do not have a large market share and require close analysis.
Limitations of the Matrix
The matrix is a decision-making tool and does not consider all business factors. Mid-sized businesses are not reflected in the matrix, and it assumes all businesses operate independently. The matrix was created by Bruce Henderson in 1970.
Example of a BCG Growth Matrix
Apple is a company that can be analyzed using the growth matrix. Its products include the iPhone (star), Mac products (cash cow), Apple TV (question mark), and iPad (dog).
What Are the 4 Quadrants of the BCG Matrix?
The four quadrants of the BCG matrix are:
– Low Growth, High Share: Cash cows.
– High Growth, High Share: Stars.
– High Growth, Low Share: Question marks.
– Low Share, Low Growth: Dogs.
How Does the BCG Matrix Work?
The matrix assigns businesses to one of the four categories based on growth prospects and market share. Executives can then allocate resources and capital accordingly.
Is the BCG Matrix Used in the Real World?
The matrix was previously used by many Fortune 500 companies and continues to be taught in business schools.
The Bottom Line
The BCG Growth-Share Matrix helps companies prioritize and identify business aspects to focus on. By categorizing businesses into dogs, cash cows, stars, and question marks, companies can make informed decisions about resource allocation.


