Understanding the Cboe SKEW Index Its Prediction Value

Contents
Understanding the Cboe SKEW Index & Its Prediction Value
What Is the Cboe SKEW Index?
The Cboe SKEW index measures risk in financial markets. Similar to the VIX index, it can be a proxy for investor sentiment and volatility. The SKEW measures tail-risk in the S&P 500, which refers to price changes with low probability that place it on the far ends of the normal distribution curve.
Key Takeaways
- The Cboe SKEW Index (SKEW) measures tail-risk in S&P 500 investment returns over a 30-day horizon.
- A SKEW rating of 100 means the perceived distribution of S&P 500 returns is normal, and the probability of an outlier return is small.
- The SKEW index has been a poor indicator of stock market volatility and fails to accurately predict black swan events.
Understanding the SKEW Index
The SKEW index is calculated using S&P 500 options that measure tail risk in S&P 500 returns over the next 30 days. The primary difference between the VIX and the SKEW is that the VIX is based on implied volatility at the at-the-money (ATM) strike price, while the SKEW considers implied volatility of out-of-the-money (OTM) strikes.
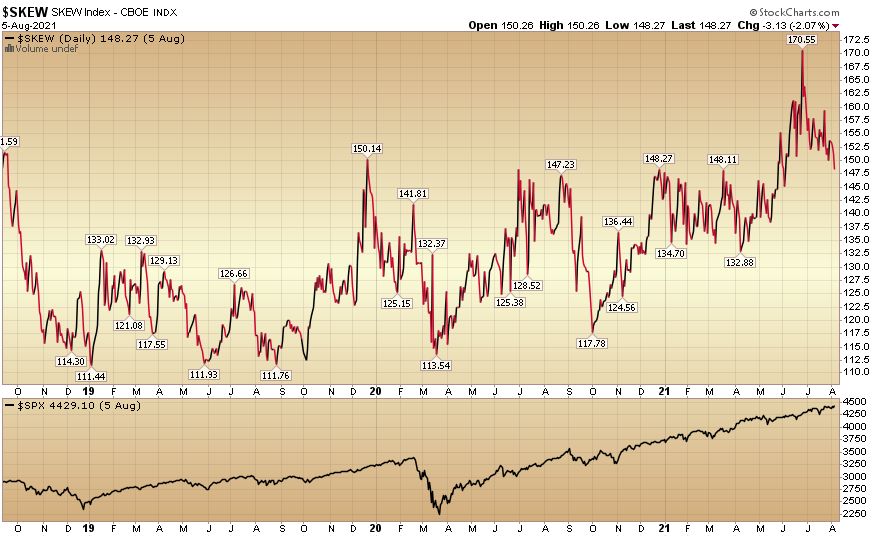
SKEW values generally range from 100 to 150, where a higher rating implies higher perceived tail risk and chance of a black swan event. A SKEW rating of 100 means the perceived distribution of S&P 500 returns is normal, and the probability of an outlier return is small.
The index measures the slope of implied volatility, which can be expressed as the probability of a two or three standard deviation move by the S&P 500 over the next 30 days. Skew can help determine risk.
Each five-point move in the SKEW Index adds or subtracts around 1.3 to 1.4% points to the risk of a two-standard deviation move. Similarly, a five-point move in the index adds or subtracts approximately 0.3% points to a three-standard deviation move.
The index increases market awareness among investors. A higher slope of implied volatility raises the SKEW Index, indicating an increased likelihood of a black swan event, but not guaranteeing its occurrence.
Despite its popularity, the SKEW index has been shown to be a poor indicator of stock market volatility. Historical data analysis reveals that none of the worst market declines were preceded by a SKEW index in the top 5% of historical values. Therefore, the SKEW index fails to predict actual tail risk.


