Ultimate Oscillator Definition Formula and Strategies

Ultimate Oscillator: Definition, Formula, and Strategies
What is the Ultimate Oscillator?
The Ultimate Oscillator is a technical indicator developed by Larry Williams in 1976 to measure the price momentum of an asset across multiple timeframes. It uses the weighted average of three timeframes to reduce volatility and generate fewer trade signals compared to other oscillators. Buy and sell signals are based on divergences.
Key Takeaways
– The indicator uses three timeframes: seven, 14, and 28 periods.
– The shorter timeframe has the most weight, while the longer timeframe has the least weight.
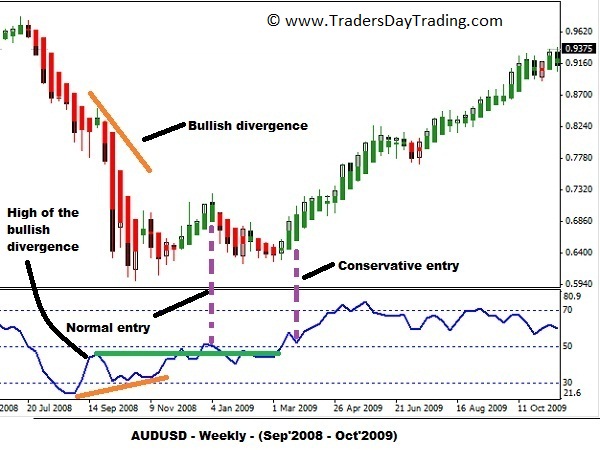
– Buy signals occur with bullish divergence below 30 and the oscillator rising above the high.
– Sell signals occur with bearish divergence above 70 and the oscillator falling below the low.
The Formula for the Ultimate Oscillator Is:
UO = [(A7 × 4) + (A14 × 2) + A28] × 100
Where:
UO = Ultimate Oscillator
A = Average Buying Pressure
BP = Close − Min (Low, PC)
PC = Prior Close
TR = Max (High, Prior Close) − Min (Low, Prior Close)
Average 7 = ∑ p = 1 7 BP / ∑ p = 1 7 TR
Average 14 = ∑ p = 1 14 BP / ∑ p = 1 14 TR
Average 28 = ∑ p = 1 28 BP / ∑ p = 1 28 TR
How to Calculate the Ultimate Oscillator
1. Calculate the Buying Pressure (BP) as the difference between the close price and the lower of the period’s low or prior close. Sum up these values over the last seven, 14, and 28 periods to create BP Sum.
2. Calculate the True Range (TR) as the difference between the current period’s high or the prior close and the lower value of the current period’s low or the prior close. Sum up these values over the last seven, 14, and 28 periods to create TR Sum.
3. Calculate Average 7, 14, and 28 using the BP and TR Sums from steps one and two.
4. Calculate the Ultimate Oscillator using the Average 7, 14, and 28 values, weighted by four, two, and one respectively. Divide the sum by seven and multiply by 100.
What Does the Ultimate Oscillator Tell You?
The Ultimate Oscillator is a range-bound indicator that fluctuates between 0 and 100. Levels below 30 are considered oversold, while levels above 70 are considered overbought. Trading signals are generated based on divergences between the price and the indicator using a three-step method.
The Ultimate Oscillator was developed by Larry Williams in 1976 to incorporate multiple timeframes and reduce false divergences found in other oscillators. Single timeframe oscillators often produce false divergences when the price surges, but the oscillator falls.
To generate a buy signal, Williams recommends:
1. Forming a bullish divergence.
2. Having the lower low of the divergence below 30.
3. Seeing the Ultimate Oscillator rise above the divergence high.
The same three-step method applies to sell signals, but with bearish divergences and a higher high above 70.
The Difference Between the Ultimate Oscillator and Stochastic Oscillator
The Ultimate Oscillator uses three timeframes, while the Stochastic Oscillator uses only one. The Ultimate Oscillator doesn’t usually have a signal line, unlike the Stochastic Oscillator. Both indicators generate trade signals based on divergences, but the calculations differ. The Ultimate Oscillator utilizes a three-step method for trading divergences.
Limitations of Using the Ultimate Oscillator
While the three-step trading method helps eliminate poor trades, it may also exclude many good ones. Divergence is not present at all price reversal points, and reversals don’t always occur from overbought or oversold territory. Waiting for the oscillator to move above the divergence high or below the divergence low could result in entering a position after the price has already moved significantly.
As with all indicators, it’s important to use the Ultimate Oscillator as part of a complete trading plan that incorporates other forms of analysis, such as price analysis, other technical indicators, and fundamental analysis.


