Up Down Gap Side-by-Side White Lines What it is How it Works

Up/Down Gap Side-by-Side White Lines: What it is, How it Works
What Is Up/Down Gap Side-by-Side White Lines?
The up/down gap side-by-side white lines is a three-candle continuation pattern on candlestick charts.
Key Takeaways
- The up/down gap side-by-side white lines is a three-candle continuation pattern on candlestick charts.
- The up version is a white candle followed by a gap up and two white candles of similar size.
- The down version is a black candle followed by a gap down and two white candles of similar size.
- The pattern is a continuation pattern, meaning the price is expected to move in the direction of the trend (first candle) after the pattern.
- The pattern has moderate reliability, with the price move after the pattern often being muted, indicating it is not highly significant.
Understanding Up/Down Gap Side-by-Side White Lines
The up version is a large up (white or green) candle followed by a gap and then two more white candles of similar size. The down version is a large down (black or red) candle followed by two white candles of similar size. When the pattern occurs, which is rare, it is expected that the price will continue moving in the current trend—down or up.
The up gap side-by-side white lines is a bullish continuation pattern with the following characteristics:
- The market is in an uptrend.
- The first candle is a white candle.
- The second candle opens above the close of the first candle (gap up).
- The third candle has a real body with the same length as the second candle with an open that’s at the same level or higher than the real body of the first candle.
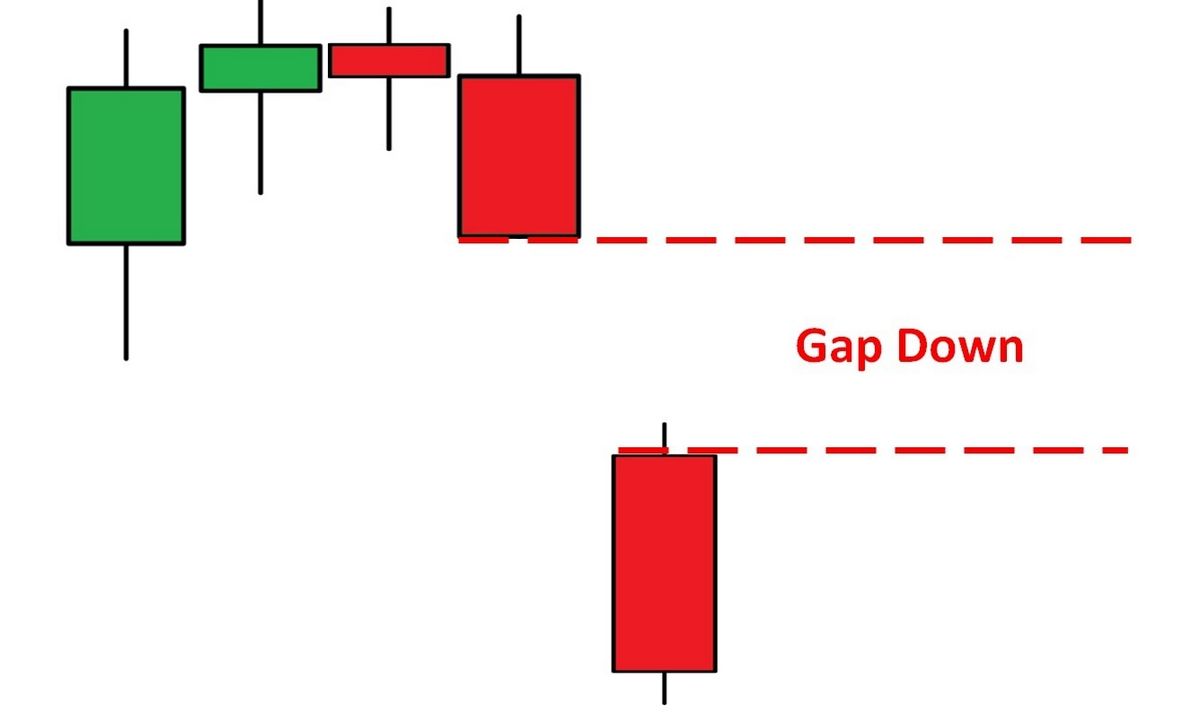
The down gap side-by-side white lines is a bearish continuation pattern with the following characteristics:
- The market is in a downtrend.
- The first candle is a black candle.
- The second candle is a white candle that opens below the close of the first candle (gap down).
- The third candle is a white candle with a real body that’s the same length as the second candle and opens at the same level or lower than the real body of the first candle.
Other chart patterns or technical indicators should be used to confirm the candlestick pattern to maximize the odds of success.
Traders often wait for confirmation from the pattern, such as the price moving above the highs of the pattern before initiating a long position. A stop loss could then be placed below the low of the second or third candle or even the first candle to give the trade more room.
The difference between up/down gap side-by-side white lines and a three outside up/down candlestick pattern is that the latter is a reversal pattern, not a continuation pattern. In the outside up pattern, a black candlestick is followed by two white candles. In the outside down pattern, a white candle is followed by two black candles.
Up/Down Gap Side-by-Side White Lines Psychology
- Up — In an uptrend, the first candle shows a rally with a large real body and a close higher than the open. Bull confidence increases further on the second candle, with an up gap and positive intraday price action. Bullish resolve is tested on the third candle, but the decline fails to gain traction, revealing diminishing bear power and raising odds for a rally and new high on the next candle.
- Down — In a downtrend, the first candle posts a sell-off bar with a large real body and a close lower than the open. Bear confidence is shaken on the second candle, with a down gap and strong intraday price action. Bearish resolve grows on the third candle, but strong intraday price action fails to pierce gap resistance, revealing diminishing bull power and raising odds for a decline and new low on the next candle.
Up Gap Side-by-Side White Lines Example
The Apple Inc. (AAPL) daily chart shows an example of the up gap version of the candlestick pattern.
Coming off a swing low, the price has a large up candle followed by a gap and then two additional side-by-side up candles. The next day, the price continued to rally, moving above the high of candles two and three. This provided confirmation that the uptrend was continuing. The rally lasted a few more days before drifting sideways.
Up/Down Gap Side by Side White Lines Limitations
- The pattern is rare, limiting its usefulness and opportunities to use it.
- The pattern has moderate reliability and should be confirmed by other forms of analysis and trade signals.
- The down gap version occurring in a downtrend tends to produce larger price moves.
- The pattern serves as a downtrend continuation pattern.
- This pattern, like candlestick patterns in general, doesn’t provide a price target. It is up to the trader to determine when they will exit a profitable trade. Waiting for price confirmation following the pattern is recommended.


