True Strength Index TSI Formula Calculations and Interpretation

Contents
- 1 True Strength Index (TSI): Formula, Calculations, and Interpretation
- 1.1 What Is the True Strength Index (TSI)?
- 1.2 Formula and How to Calculate the TSI
- 1.3 How the TSI Works
- 1.4 How to Interpret the TSI
- 1.5 The TSI vs. the Moving Average Convergence Divergence (MACD) Indicator
- 1.6 Limitations of the TSI
- 1.7 Who Created the True Strength Index?
- 1.8 What Is Technical Analysis?
- 1.9 How Do You Calculate the True Strength Index?
- 1.10 The Bottom Line
True Strength Index (TSI): Formula, Calculations, and Interpretation
What Is the True Strength Index (TSI)?
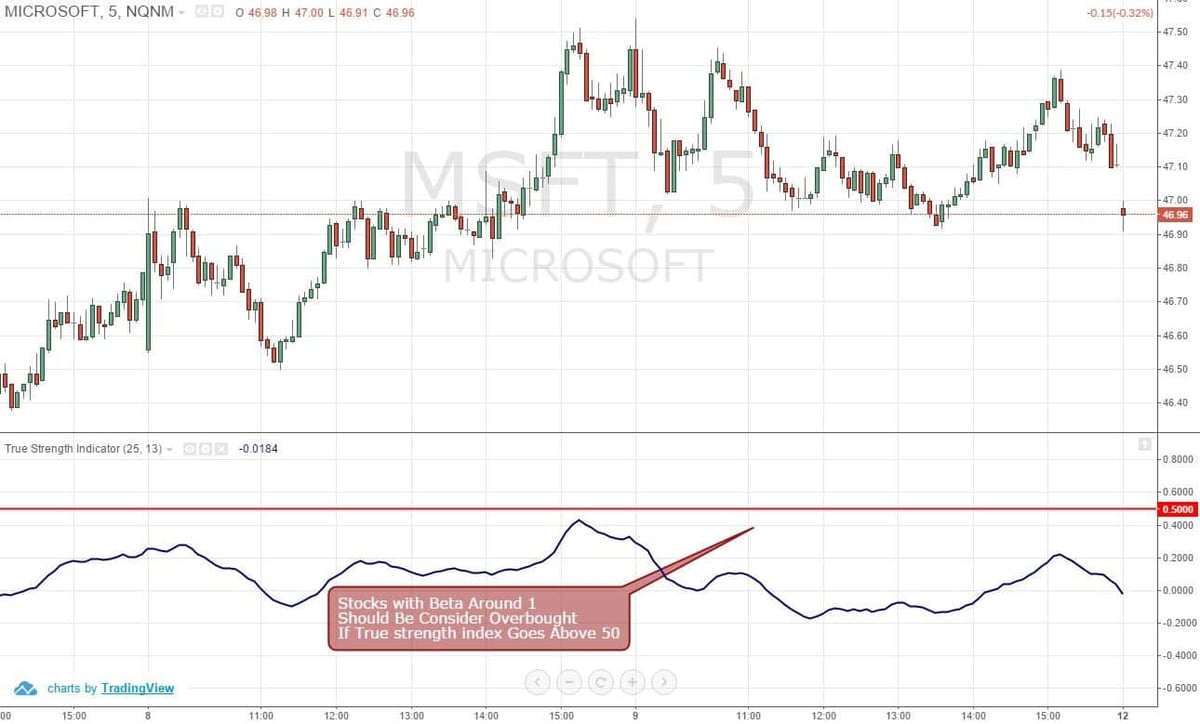
The true strength index (TSI) is a technical momentum oscillator used by technical analysts. It identifies trends and reversals in the market, determines overbought and oversold conditions, indicates potential trend direction changes via crossovers, and warns of trend weakness through divergence.
Key Takeaways
- The TSI is a technical momentum oscillator used by analysts to identify market trends and reversals.
- The TSI fluctuates between positive and negative territory.
- Divergence between the TSI and price can signal weakening and potential reversals.
- A cross above the signal line is a buy signal, while a cross below is a sell signal.
- Overbought and oversold levels vary by asset.
Formula and How to Calculate the TSI
The TSI is calculated using the following steps:
- Record price changes and absolute price changes to calculate EMAs.
- Calculate 25-period EMAs for both price change and absolute price change.
- Apply a 13-period EMA to the EMAs from step two.
- Plug the double-smoothed values into the TSI formula.
How the TSI Works
Technical analysis involves analyzing past performance to identify trading opportunities. The TSI measures the strength and direction of an asset’s price movement over time. It is primarily used to identify overbought and oversold conditions, spot divergence, and highlight short-term momentum.
Overbought and oversold levels of the TSI vary by asset. Traders watch for signals such as price drops or signal line crossovers to trigger trade decisions. However, being oversold or overbought does not always indicate a buy or sell signal.
How to Interpret the TSI
The TSI helps identify trends and patterns through crossovers and divergence. Signal line crossovers occur when the TSI line crosses the signal line, providing buy and sell signals. Centerline crossovers indicate positive and negative momentum. Breakouts and divergence can also be identified using the TSI in conjunction with other forms of analysis.
The TSI vs. the Moving Average Convergence Divergence (MACD) Indicator
The TSI and MACD are both used to identify trends and changes in the market. However, they are calculated differently and provide different signals at different times.
Limitations of the TSI
Many signals generated by the TSI may be false signals, leading to unexpected price actions. Divergence can last for a long time without indicating a reversal. It is important to combine the TSI with other indicators and forms of analysis to make informed trading decisions.
Who Created the True Strength Index?
The TSI was created by William Blau and introduced in the Stocks & Commodities magazine in 1991. It is a smooth momentum indicator useful for expressing market trends.
What Is Technical Analysis?
Technical analysis is a trading discipline that uses various tools and techniques to identify trading patterns and trends. It relies on historical data, indexes, signals, graphs, and charts to make predictions about asset and market movement.
How Do You Calculate the True Strength Index?
To calculate the TSI, follow these steps:
- Record price and absolute price changes.
- Calculate EMAs for both values.
- Apply a 13-period EMA to each.
The Bottom Line
The true strength index is a technical oscillator that helps identify market trends, signals, and patterns. Use the TSI in conjunction with other analysis methods to mitigate losses and make well-informed investment decisions.


