Triangle Chart Pattern in Technical Analysis Explained

Contents
- 1 Triangle Chart Pattern in Technical Analysis Explained
Triangle Chart Pattern in Technical Analysis Explained
What Is a Triangle Chart Pattern?
A triangle is a chart pattern used in technical analysis. It resembles a triangle and is depicted by trendlines along a converging price range, indicating a pause in the prevailing trend. Triangle patterns can be continuation or reversal patterns. Traders should look for breakouts before entering or exiting a position.
Key Takeaways
- A triangle is a continuation pattern on a chart that forms a triangle-like shape.
- Triangles can be continuation patterns or powerful reversal patterns.
- There are three potential triangle variations: ascending, descending, and symmetrical triangles.
Understanding Triangle Chart Patterns
Triangle chart patterns are used in technical analysis to identify trends and make predictions about future performance. The upper and lower trendlines converge to form a triangle pattern. Triangles are similar to wedges and pennants and can be continuation patterns or reversal patterns. Traders use triangles to signal narrowing trading ranges after uptrends or downtrends.
There are three potential triangle variations: ascending, descending, and symmetrical triangles. A breakout or failure of a triangular pattern can be a bullish or bearish signal.
While technical tools can help predict future trends, the market remains unpredictable.
Types of Triangle Chart Patterns
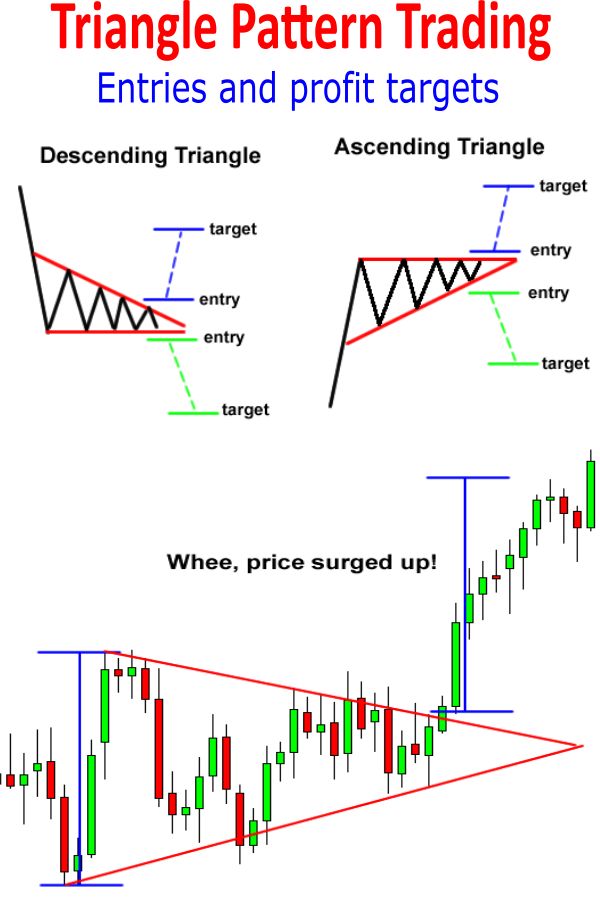
The three basic types of triangle chart patterns are ascending, descending, and symmetrical triangles.
Ascending Triangle
An ascending triangle is a bullish breakout pattern where the price breaches the upper trendline with rising volume.
The upper trendline is horizontal, indicating nearly identical highs. The lower trendline rises diagonally, indicating higher lows.
Descending Triangle
A descending triangle is a bearish breakdown pattern where the price collapses through the lower trendline support.
The lower trendline is horizontal, connecting near identical lows. The upper trendline declines diagonally.
Symmetrical Triangle
A symmetrical triangle has a diagonal upper trendline and a diagonal lower trendline.
The breakout or breakdown occurs at the apex with rising or falling prices respectively.
What Is Technical Analysis?
Technical analysis is a trading strategy using historical data to predict future market movements.
How Do Triangles Work in Technical Analysis?
Triangles are chart patterns that connect the upper and lower trendlines to form a triangle shape.
Are Triangle Patterns Bullish or Bearish?
The nature of a triangle pattern depends on the type. Ascending triangles are bullish and can indicate the continuation or reversal of a trend. Descending triangles are bearish and suggest a continuation or reversal.
The Bottom Line
Technical analysis requires practice and patience. Triangle patterns, like any other trading tool, are only effective when confirmed by breakout in price action.


