Trend Trading Definition and How Strategy Aims For Profit
")
Trend Trading: Definition and Strategy for Profit
What Is Trend Trading?
Trend trading captures gains by analyzing an asset’s momentum in one direction, known as a trend. In an uptrend, trend traders enter a long position, characterized by higher swing lows and highs. In a downtrend, trend traders enter a short position, characterized by lower swing lows and highs.
Key Takeaways
Trend trading takes advantage of uptrends (new highs) and downtrends (new lows).
Trend traders use tools like trendlines, moving averages, and technical indicators to identify trends and trade signals.
Understanding Trend Trading
Trend trading assumes that a security will continue in its current direction, with strategies including take-profit and stop-loss measures to lock in profits or avoid losses. Traders use price action and technical tools to determine trend direction and shifts.
Price action traders analyze chart movements and look for price to move above recent highs in uptrends. They also observe if the price stays above previous swing lows to confirm the overall upward trajectory. Similarly, downtrends are identified by lower lows and lower highs.
Trend Trading Strategies
Multiple strategies exist, each with different indicators and price action methods. Risk is managed with stop-loss orders placed below swing lows for uptrends and above swing highs for downtrends.
Traders often combine strategies, such as looking for breakouts through resistance levels or entering trades when the price is above a specific moving average.
Moving Averages
One common strategy involves short-term moving averages crossing above or below longer-term moving averages. Moving averages are also used for analysis, with a price above indicating an uptrend and below indicating a downtrend.
Momentum Indicators
Momentum indicators, like the relative strength index (RSI), can confirm uptrends. For example, when the RSI drops below 30 and rises again, it signals a long position if the overall uptrend remains intact. Exiting the trade can occur when the RSI rises above 70 or 80 and then falls.
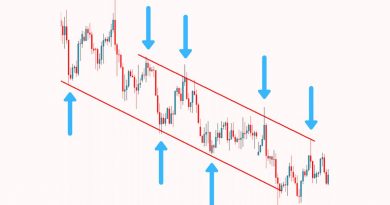
Trendlines & Chart Patterns
Trendlines are drawn along swing lows in an uptrend or swing highs in a downtrend, indicating potential areas for future price pullbacks. Traders may buy during uptrends when the price bounces off rising trendlines or short during downtrends when the price rises and falls away from declining trendlines. Chart patterns such as flags or triangles also indicate trend continuation.
Trend Trading Chart Example
The Alibaba Group chart shows examples of trend analysis and potential trades using chart patterns. The price initially forms a downtrend but eventually breaks the trendline and moving average, confirming an uptrend. Chart patterns along the way offer opportunities to enter or add to a long position. However, warning signs like breaking the moving average and forming lower swing lows suggest the uptrend is weakening. Eventually, the price enters a downtrend, prompting trend traders to exit long positions and consider short positions.