Trade Volume Index TVI What it is How it Works

Contents
Trade Volume Index (TVI): What it is, How it Works
What is the Trade Volume Index (TVI)
The Trade Volume Index (TVI) is a technical indicator that moves significantly in the direction of a price trend when substantial price changes and volume occur simultaneously. Unlike other technical indicators, the TVI is typically based on intraday price data.
Understanding Trade Volume Index (TVI)
The Trade Volume Index (TVI) is similar to the on-balance volume indicator. It can also be compared to other volume indicators like volume weighted average price (VWAP), the Positive and Negative Volume Indexes, the Intraday Intensity Index, and Chaikin’s Money Flow.
Calculating the TVI
The Trade Volume Index is commonly provided by technical charting software. The calculation can vary depending on the program, but the most common and simplified approach is a calculation based on tick value at intraday price intervals. Traders can customize the tick value when using this indicator.
There are several components involved in calculating TVI. First is the minimum tick value (MTV), usually set at 0.5. Then, the change in price is calculated by subtracting the intraday price from the last intraday price. The TVI calculation is as follows:
If the change in price is greater than the MTV, then TVI = Last TVI + Volume (Accumulation)
If the change in price is less than -MTV, then TVI = Last TVI – Volume (Distribution)
If the change in price is between MTV and -MTV, then TVI remains unchanged.
Using the TVI
Volume indicators provide support for trading signals at different points in a security’s price chart. When volume supports a price change, it can indicate high conviction trading signals. This can occur when high volume is associated with bullish or bearish trading, indicating a common sentiment among most investors.
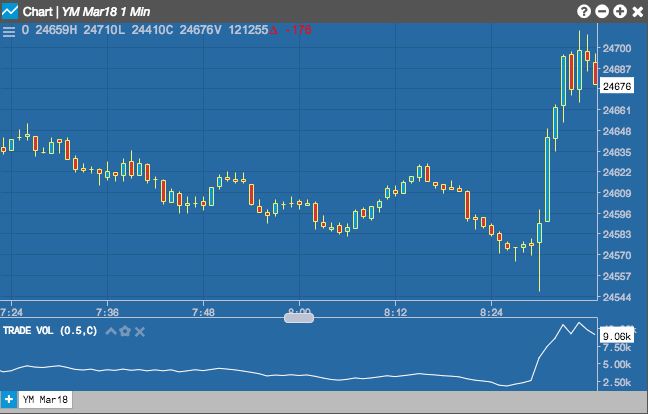
The Trade Volume Index combines volume with price movements. When the change in price is greater than the MTV, it is referred to as accumulation and volume is added. When the price decreases and the change is less than -MTV, it is referred to as distribution and volume is subtracted. As a result, the TVI increases when substantial price increases occur with high volume and decreases when substantial price decreases occur with high volume.
Other Volume Indicators
The TVI is typically displayed in a window below the candlestick pattern. It can be used as an overlay to volume. It can also be charted with other volume indicators such as the on-balance volume indicator, volume weighted average price (VWAP), the Positive and Negative Volume Indexes, the Intraday Intensity Index, or Chaikin’s Money Flow.
For more on volume indicators, see: How to Use Volume to Improve Your Trading.


