What Are Fibonacci Retracement Levels and What Do They Tell You

Contents
- 1 What Are Fibonacci Retracement Levels, and What Do They Tell You?
- 1.1 What Are Fibonacci Retracement Levels?
- 1.2 Numbers First Formulated in Ancient India
- 1.3 The Formula for Fibonacci Retracement Levels
- 1.4 How to Calculate Fibonacci Retracement Levels
- 1.5 What Do Fibonacci Retracement Levels Tell You?
- 1.6 Fibonacci Retracements vs. Fibonacci Extensions
- 1.7 Limitations of Using Fibonacci Retracement Levels
- 1.8 Why Are Fibonacci Retracements Important?
- 1.9 What Are the Fibonacci Ratios?
- 1.10 How Do You Apply Fibonacci Retracement Levels?
- 1.11 How Do You Draw a Fibonacci Retracement?
- 1.12 The Bottom Line
What Are Fibonacci Retracement Levels, and What Do They Tell You?
What Are Fibonacci Retracement Levels?
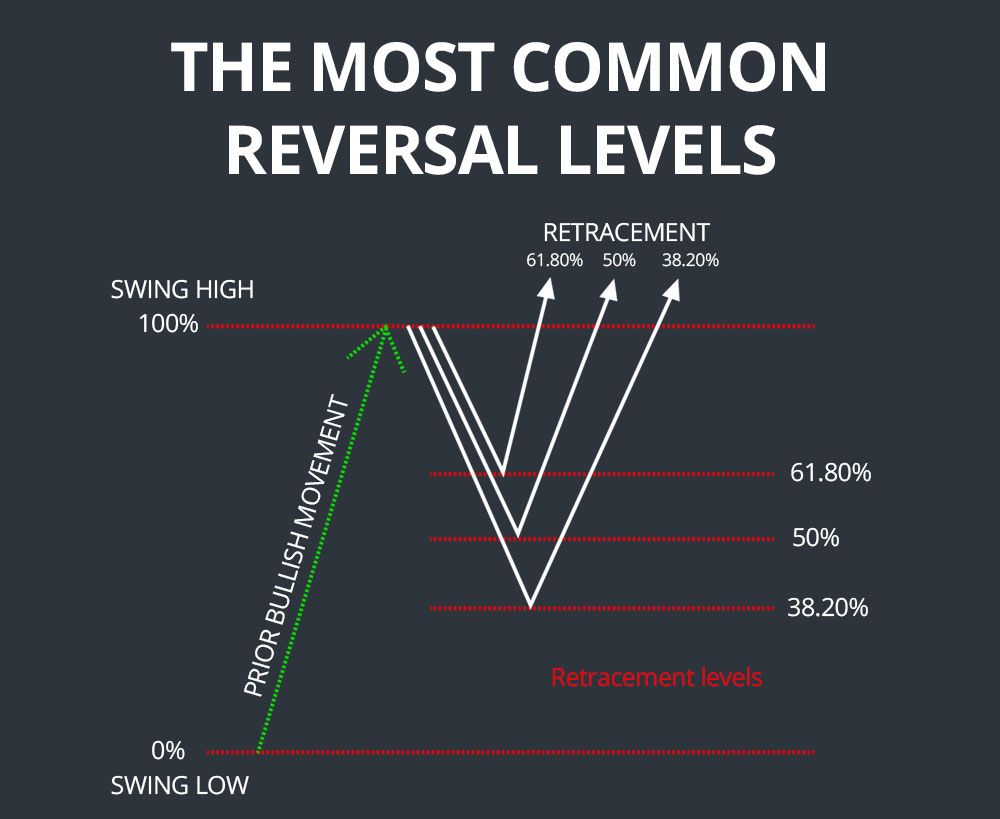
Fibonacci retracement levels are horizontal lines that indicate support and resistance levels.
Each level is associated with a percentage of a prior move. The levels are 23.6%, 38.2%, 61.8%, 78.6%, and 50%.
The indicator can be drawn between any two price points, such as a high and a low, to create the levels.
For example, if a stock rises $10 and then drops $2.36, it has retraced 23.6%. Traders believe these numbers have relevance in financial markets.
The levels were named after Leonardo Fibonacci, an Italian mathematician who introduced them to western Europe.
Key Takeaways
- Fibonacci retracement levels connect relevant points in a chart.
- They provide areas where the price could stall or reverse.
- The ratios most commonly used include 23.6%, 38.2%, 50%, 61.8%, and 78.6%.
- These levels should not be relied upon exclusively.
- Fibonacci numbers and sequencing were first used by Indian mathematicians.
Numbers First Formulated in Ancient India
The Fibonacci sequence was developed by Indian mathematicians before being shared with western Europe.
Acarya Virahanka, an Indian mathematician, is known to have developed Fibonacci numbers around 600-800 A.D.
It is estimated that Fibonacci numbers existed in Indian society as early as 100 B.C to 350 AD.
The Formula for Fibonacci Retracement Levels
Fibonacci retracement levels do not have formulas. They are simply percentages of a chosen price range.
For example, if the price rises from $10 to $15, the 23.6% level would be at $13.82.
How to Calculate Fibonacci Retracement Levels
There is nothing to calculate for Fibonacci retracement levels. They are static percentages.
These numbers are based on the Fibonacci sequence, which is derived from the Golden Ratio.
The Golden Ratio, known as the divine proportion, is found in various aspects of nature and human DNA.
What Do Fibonacci Retracement Levels Tell You?
Fibonacci retracements can be used for entry orders, stop-loss levels, and price targets.
They also arise in other techniques like Gartley patterns and Elliott Wave theory.
Other analysis tools should be used alongside Fibonacci retracement levels for accurate identification of market trends.
Fibonacci Retracements vs. Fibonacci Extensions
Fibonacci retracements apply percentages to a pullback, while Fibonacci extensions apply percentages to a move in the trending direction.
Limitations of Using Fibonacci Retracement Levels
Fibonacci retracement levels indicate potential support or resistance, but there are no guarantees.
Traders often use confirmation signals and other indicators for more accurate assessments of trends.
Why Are Fibonacci Retracements Important?
Fibonacci retracement levels indicate key areas of support and resistance in technical analysis.
What Are the Fibonacci Ratios?
The Fibonacci ratios are derived from the Fibonacci sequence. They are: 23.6%, 38.2%, 50%, 61.8%, 78.6%, 100%, 161.8%, 261.8%, and 423.6%.
How Do You Apply Fibonacci Retracement Levels?
Traders can use Fibonacci retracement levels to determine entry points based on significant retracements.
How Do You Draw a Fibonacci Retracement?
To draw Fibonacci retracement levels, connect significant points on a chart and place horizontal lines at the Fibonacci levels.
The Bottom Line
Fibonacci retracements are useful tools for identifying support and resistance levels.
Other indicators should be used in conjunction with Fibonacci retracement levels for more accurate analysis.


