Volume Analysis How to Calculate its Meaning

Volume Analysis: Calculating Meaning
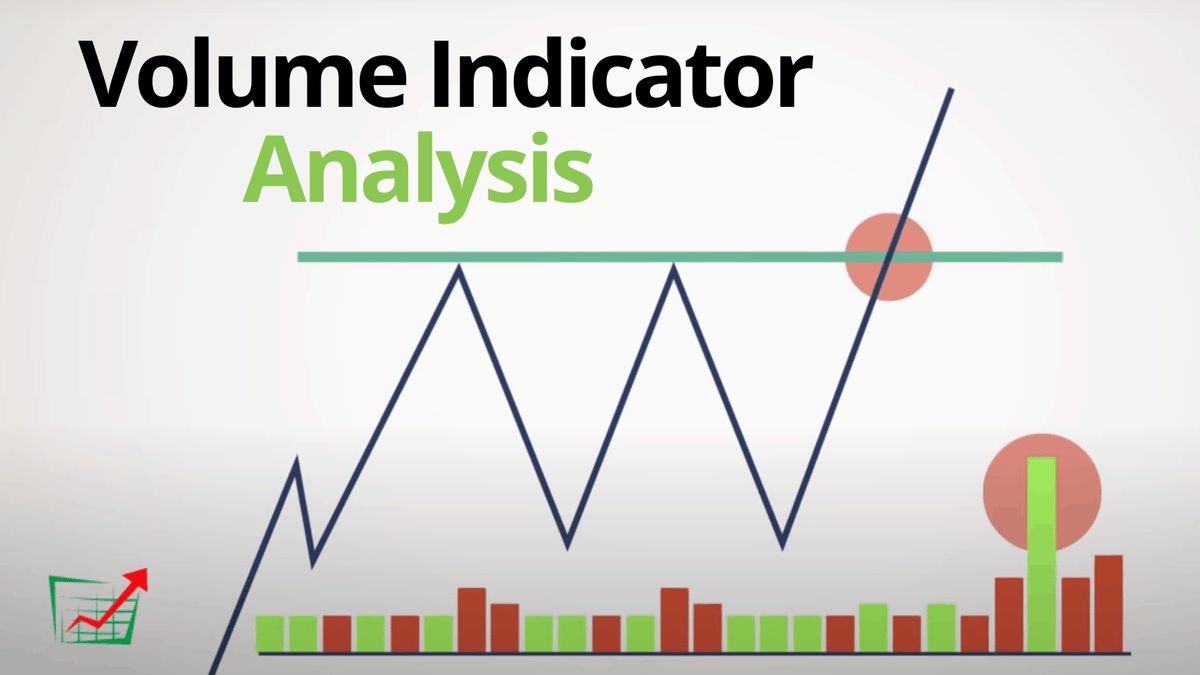
Volume analysis examines the number of shares or contracts traded in a given period. Technical analysts use volume analysis to inform trading decisions. By analyzing volume trends alongside price movements, investors can determine the significance of price changes.
Key Takeaways:
– Volume analysis examines relative or absolute changes in trading volume to infer future price movements.
– Volume can indicate market strength. Rising markets with increasing volume are seen as strong, while falling markets with increasing volume indicate a strengthening trend to the downside.
– Technical analysts use various tools, such as the positive volume index (PVI), in volume analysis.
Understanding Volume Analysis:
Volume analysis is done by analysts who follow specific securities. Volume refers to the number of shares traded per day. Comparing the entire market’s trading volume to the volume of a single holding helps identify volume trends.
High trading volumes can reveal investors’ outlook on a market or security. A significant increase in price, along with a significant increase in volume, could signal a continued or reversed bullish trend. Conversely, a significant decrease in price with a significant increase in volume could indicate a continued or reversed bearish trend.
Technical analysts should include volume charts in daily charting diagrams. These charts are available below a standard candlestick graph and often display moving average trendlines.
Incorporating volume into a trading decision helps investors have a more balanced view of market factors that influence a security’s price, allowing for more informed decisions.
Volume Indicators:
Two popular indicators in technical analysis, the positive volume index (PVI) and negative volume index (NVI), support investors who use volume in trading decisions. These indexes, developed by Paul Dysart in the 1930s and discussed in the book "Stock Market Logic" by Norman Fosback, calculate how volume affects price.
When PVI increases or decreases, it means price changes are driven by high volumes. Conversely, when NVI increases or decreases, it means prices fluctuate with little effect from volume.
Calculating the Positive Volume Index:
If the current volume is greater than the previous day’s volume:
PVI = PVI previous + (CP today – CP yesterday / CP yesterday) * PVI previous
where:
– PVI previous = The previous PVI
– CP today = Today’s closing price
– CP previous = The previous closing price
If the current volume is lower than the previous day’s volume, PVI is unchanged.
Negative Volume Index:
If the current volume is less than the previous day’s volume:
NVI = NVI previous + (CP today – CP yesterday / CP yesterday) * NVI previous
where:
– NVI previous = The previous NVI
– CP today = Today’s closing price
– CP previous = The previous closing price
If the current volume is higher than the previous day’s volume, NVI is unchanged. Many investors follow the Negative Volume Index for insights into professional traders’ market activity, as they believe noise trading plays a significant role in the Positive Volume Index.


