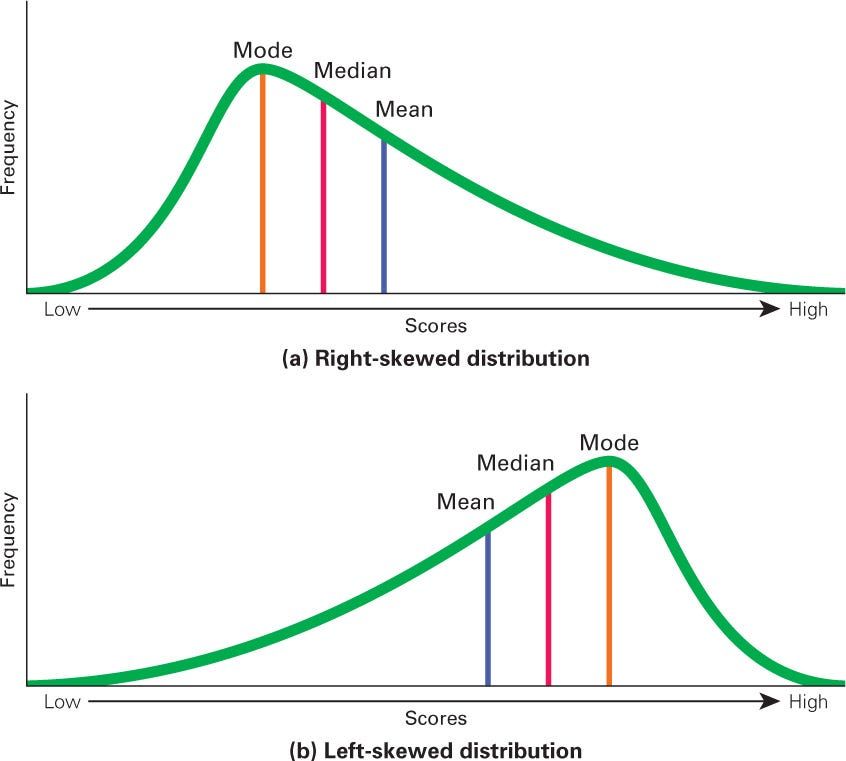
Right Skewed vs Left Skewed Distribution

Right Skewed vs. Left Skewed Distribution
Skewness is the degree of asymmetry observed in a probability distribution. When data points on a bell curve are not distributed symmetrically to the left and right sides of the median, the bell curve is skewed. Distributions can be positive and right-skewed, or negative and left-skewed. A normal distribution exhibits zero skewness.
Types of Skews
Negative, or left-skewed refers to a longer or fatter tail on the left side of the distribution, while positive, or right-skewed, refers to a longer or fatter tail on the right. These two skews show the direction or weight of the distribution.
The three probability distributions below are right-skewed to an increasing degree. The mean of positively skewed data will be greater than the median. In a left-skewed distribution, the mean of negatively skewed data will be less than the median.
A right-skewed or positive distribution means its tail is more pronounced on the right side than on the left. Since the distribution is positive, the assumption is that its value is positive. As such, most of the values end up left of the mean. This means that the most extreme values are on the right side.
Negative or left-skewed means the tail is more pronounced on the left rather than the right. Most values are found on the right side of the mean in negative skewness. As such, the most extreme values are found further to the left.
A zero skew means the data graph is symmetrical and reveals a normal data distribution regardless of how long or fat the distribution tails are.
Measuring Skewness
Two methods to measure skewness include Pearson’s first and second coefficients of skewness. Pearson’s first coefficient of skewness subtracts the mode from the mean and divides the difference by the standard deviation.
Pearson’s second coefficient of skewness subtracts the median from the mean, multiplies the difference by three, and divides the product by the standard deviation.
Formula for Pearson’s Skewness
Skewness tells you where the outliers occur, although it doesn’t tell you how many outliers occur.
What Does Skewness Tell Investors?
Investors note skewness when judging a return distribution because it, like kurtosis, considers the extremes of the data set rather than focusing solely on the average. Short- and medium-term investors look at extremes because they are less likely to hold a position long enough to be confident that the average will work out.
Investors commonly use standard deviation to predict future returns, but the standard deviation assumes a normal distribution. As few return distributions appear normal, skewness is a better measure to base performance predictions.
Skewness risk is the increased risk of turning up a data point of high skewness in a skewed distribution. Many financial models that attempt to predict the future performance of an asset assume a normal distribution. If the data are skewed, this model will always underestimate skewness risk in its predictions. The more skewed the data, the less accurate this financial model will be.
Right-skewed returns distribution.
Where Is Skewness Evident in the Economy?
The broad stock market is often considered to have a negatively skewed distribution. The notion is that the market often returns a small positive return and a large negative loss. However, studies have shown that the equity of an individual firm may tend to be left-skewed. A common example of skewness is displayed in the distribution of household income within the United States.
What Causes Skewness?
Skewness reflects a data set in which activity is heavily condensed in one range and less condensed in another. Imagine scores being measured at an Olympic long jump contest. Many jumpers will likely land larger distances, while a smaller amount will likely land short distances. This often creates a right-skewed distribution. Therefore, the relationship between the data points and how often they occur causes skewness.
Is Skewness Normal?
Skewness is commonly found when analyzing data sets, as there are situations where skewness is simply a component of the data set being analyzed. For example, consider the average human lifespan. As most people tend to die after reaching an elderly age, fewer individuals pass away when they are younger. In this case, skewness is expected and normal.
The Bottom Line
Skewness is a statistical measure that shows whether a distribution is distorted or asymmetrical. If it is right-skewed, it is considered positive. In this case, the values are more than zero. If the opposite is true and the tail is more pronounced on the left, then the skew is negative, where values are less than zero.


