Money Flow Index – MFI Definition and Uses

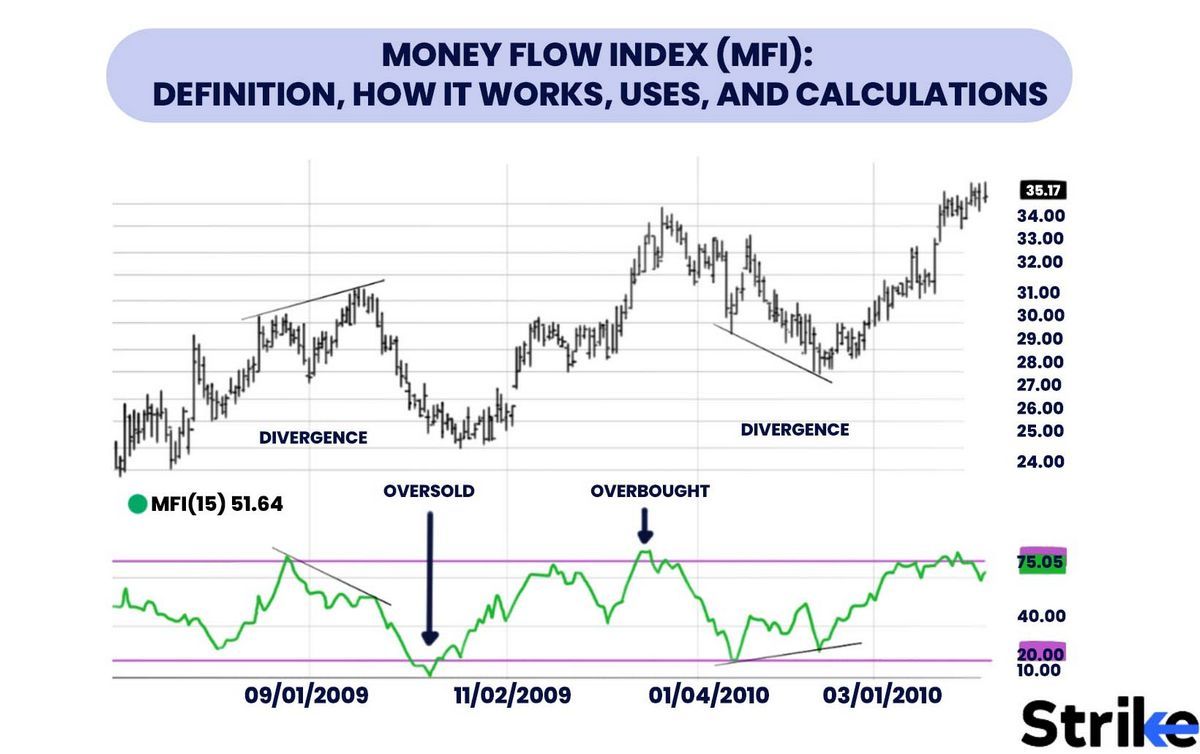
Money Flow Index (MFI) is a technical oscillator that uses price and volume data to identify overbought or oversold signals in an asset. It can also spot divergences that warn of a trend change in price. The oscillator moves between 0 and 100.
Unlike conventional oscillators like the Relative Strength Index (RSI), MFI incorporates both price and volume data. For this reason, some analysts call MFI the volume-weighted RSI.
Key Takeaways:
– MFI generates overbought or oversold signals using prices and volume data.
– An MFI reading above 80 is considered overbought, and a reading below 20 is considered oversold, although levels of 90 and 10 are also used.
– A divergence between the indicator and price is noteworthy. For example, if the indicator is rising while the price is falling or flat, the price could start rising.
Formulas for calculating the Money Flow Index:
– Money Flow Index = 100 – (100 / (1 + Money Flow Ratio))
– Money Flow Ratio = 14 Period Negative Money Flow / 14 Period Positive Money Flow
– Raw Money Flow = Typical Price * Volume
– Typical Price = (High + Low + Close) / 3
When the price advances, Raw Money Flow is positive and added to Positive Money Flow. When the price drops, Raw Money Flow is negative and added to Negative Money Flow.
Calculating the Money Flow Index:
1. Calculate the typical price for each of the last 14 periods.
2. Mark whether the typical price was higher or lower than the prior period to determine raw money flow.
3. Multiply the typical price by volume for each period to calculate raw money flow.
4. Add up all positive money flows over the last 14 periods and divide it by the negative money flows for the last 14 periods to get the money flow ratio.
5. Calculate the Money Flow Index using the ratio from step four.
6. Continue the calculations as each new period ends, considering only the last 14 periods of data.
The Money Flow Index can be used to identify divergences and potential price reversals. A high MFI falling below 80 while the security climbs signals a downside reversal. Conversely, a low MFI climbing above 20 while the security sells off signals an upside reversal.
Traders also look for larger divergences using multiple waves in price and MFI. Overbought and oversold levels can signal trading opportunities. Moves below 10 and above 90 are rare. Traders watch for the MFI to move back above 10 to signal a long trade and drop below 90 to signal a short trade.
The MFI and RSI are closely related, with the main difference being that MFI incorporates volume. Proponents of volume analysis believe MFI provides signals in a more timely fashion than RSI. Both indicators incorporate different elements and provide signals at different times.
The MFI has limitations and can produce false signals. Divergence may not always result in a price reversal. Therefore, traders should use other forms of analysis and risk control rather than relying solely on one indicator.


