Mean-Variance Analysis Definition Example and Calculation

Mean-Variance Analysis: Definition, Example, and Calculation
What Is a Mean-Variance Analysis?
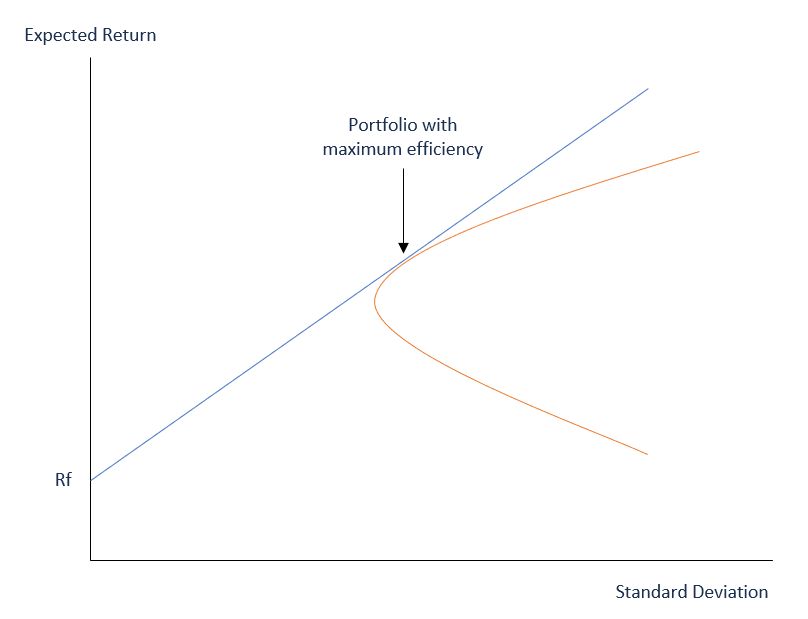
Mean-variance analysis weighs risk, expressed as variance, against expected return. Investors use it to make investment decisions, finding the biggest reward at a given level of risk or the least risk at a given level of return.
Key Takeaways:
– Mean-variance analysis helps investors determine the biggest reward at a given level of risk or the least risk at a given level of return.
– Variance shows the spread of returns for a specific security on a daily or weekly basis.
– Expected return is the estimated return of the investment in the security.
– If two securities have the same expected return but one has lower variance, the one with lower variance is preferred.
– If two securities have approximately the same variance, the one with the higher return is preferred.
Understanding Mean-Variance Analysis
Mean-variance analysis is part of modern portfolio theory, assuming that investors make rational decisions when they have complete information. It has two main components: variance and expected return. Variance represents how spread out the returns of a specific security are on a daily or weekly basis, while expected return is the estimated return of the investment. If two securities have the same expected return but different variances, the one with lower variance is better. Similarly, if two securities have approximately the same variance, the one with higher return is better.
In modern portfolio theory, investors choose securities with different levels of variance and expected return to reduce the risk of catastrophic loss during changing market conditions.
Example of Mean-Variance Analysis
We can calculate the investments with the greatest variance and expected return. Considering the following investments:
Investment A: Amount = $100,000 and expected return of 5%
Investment B: Amount = $300,000 and expected return of 10%
In a portfolio value of $400,000, the weight of each asset is:
Investment A weight = $100,000 / $400,000 = 25%
Investment B weight = $300,000 / $400,000 =75%
The total expected return of the portfolio is the weight of each asset multiplied by the respective expected return:
Portfolio expected return = (25% x 5%) + (75% x 10%) = 8.75%
Calculating the portfolio variance is more complex, considering the correlation between the two investments, which is 0.65. The standard deviation for Investment A is 7% and for Investment B is 14%.
In this example:
Portfolio variance = (25%^2 x 7%^2) + (75%^2 x 14%^2) + (2 x 25% x 75% x 7% x 14% x 0.65) = 0.0137
The portfolio standard deviation, which is the square root of the variance, is 11.71%.


