What Is a Bar Graph

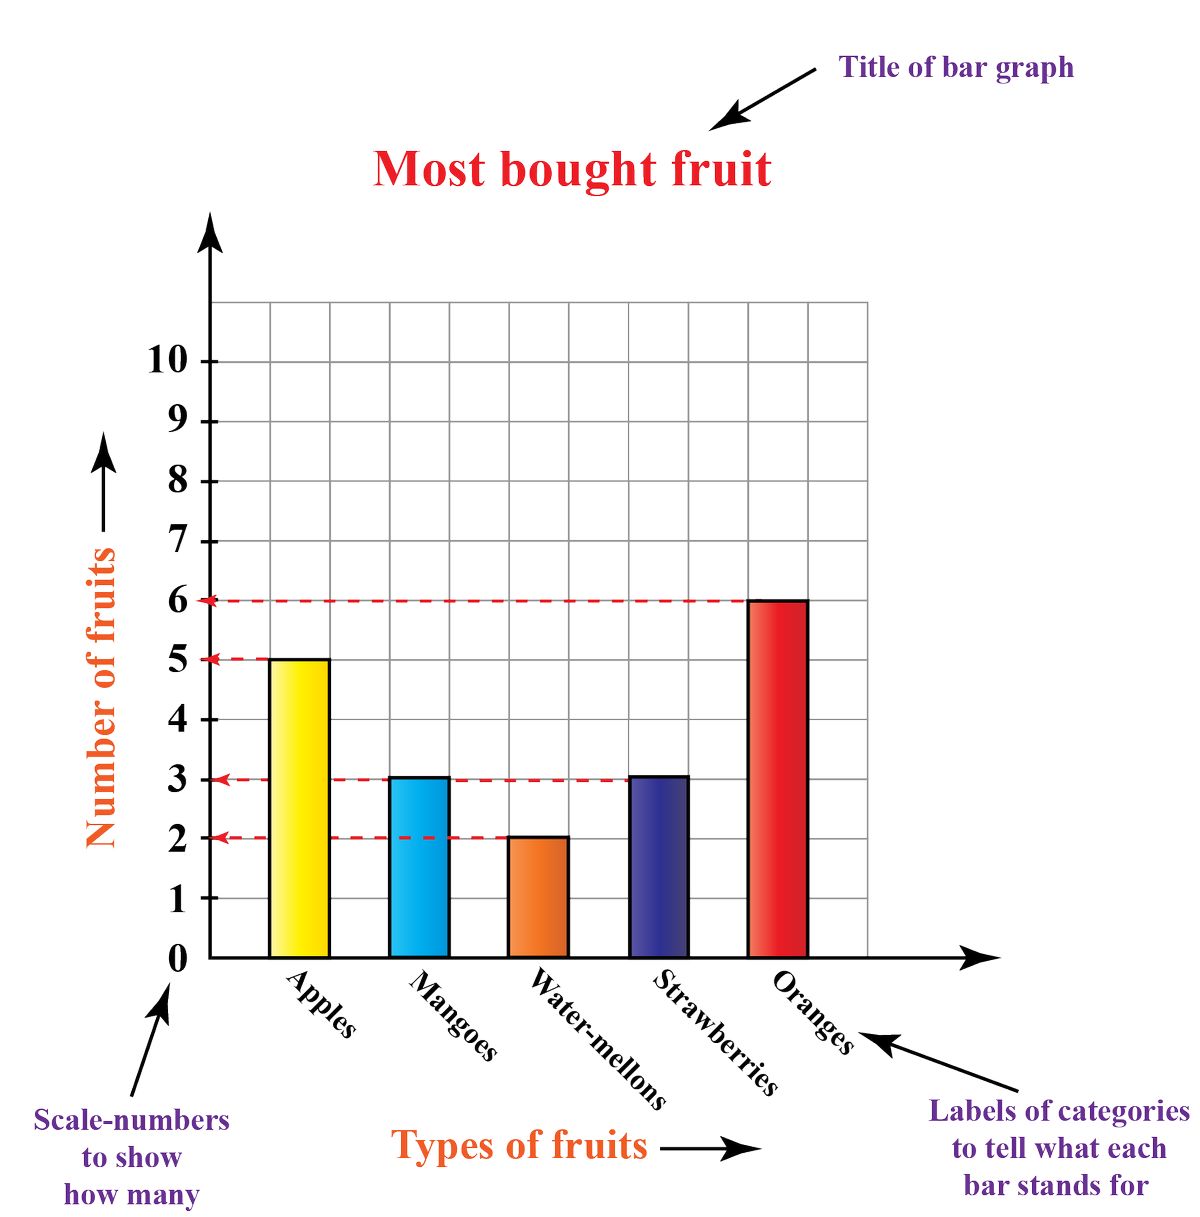
A bar graph is a graphical representation that uses different heights of bars to depict value. It can be created with vertical or horizontal bars, grouped bars, or stacked bars. Bar graphs are commonly used in business and financial analysis to display complex data quickly and effectively. Key takeaways include the ability of bar graphs to display data visually, compare categories of data, and represent labeled variables. They can also be used for comparative purposes. Understanding a bar graph involves recognizing that the bars represent the value of a particular category of data, with the vertical axis as the y-axis and the horizontal axis as the x-axis. Certain properties of bar graphs include equal width and interval spacing for the bars, the same starting point or base for all bars, and the definition of data value on the y-axis and data type on the x-axis. The height or extension of the bars corresponds to the value of the data. Grouped bar graphs and stacked bar graphs are variations that display discrete values and divide a total into parts, respectively. Bar graphs have various uses, such as presenting data visually, comparing variables and values, studying patterns over time, displaying survey results, and showing categories and sub-categories. They can also be used in technical analysis to show trading volume. Bar graphs can be distinguished from bar charts, which display open, high, low, and close prices for a security, and histograms, which depict the frequency distribution of variables in a data set. It is important to be aware of the limitations of bar graphs, as the choice of data display can impact interpretation and make data seem more compelling than it actually is. However, there are benefits to using bar graphs, such as their ability to explain complex data, compare different sets of data, and illustrate changes over time. They are used to present data in a visual and efficient way. In conclusion, bar graphs can be a valuable tool for conveying complex data and concepts in a clear and easily understandable manner.


