Uptrend in Technical Analysis How to Trade and Examples
")
Contents
- 1 Uptrend in Technical Analysis: How to Trade and Examples
- 1.1 What Is an Uptrend?
- 1.2 Understanding Uptrends
- 1.3 Trading Uptrends
- 1.4 Exiting a Profitable Uptrend Strategy
- 1.5 Example of Analyzing and Trading an Uptrend
- 1.6 Uptrends and Common Chart Patterns
- 1.7 Limitations of Uptrends in Technical Analysis
- 1.8 Trading Psychology of Uptrends
- 1.9 Key Characteristics of an Uptrend on a Price Chart
- 1.10 Identifying an Uptrend Using Trendlines
- 1.11 Using Support and Resistance Levels in Uptrend Analysis
- 1.12 Significance of Higher Highs and Higher Lows in an Uptrend
- 1.13 The Bottom Line
Uptrend in Technical Analysis: How to Trade and Examples
What Is an Uptrend?
An uptrend describes the price movement of a financial asset when the overall direction is upward. Each successive peak and trough in an uptrend is higher than the previous ones. The uptrend consists of higher swing lows and higher swing highs, indicating its continuity.
Some traders prefer to trade only during uptrends, using strategies that take advantage of the price’s tendency to make higher highs and higher lows. Uptrends can be contrasted with downtrends.
Key Takeaways
- Uptrends are characterized by higher peaks and troughs and imply bullish sentiment among investors.
- A change in trend is fueled by a change in the supply and demand dynamics of a security.
- Uptrends may coincide with positive changes in relevant factors, whether macroeconomic or specific to a company’s business model.
- During an uptrend, traders may face psychological challenges and need to avoid overconfidence and impulsive decisions.
Understanding Uptrends
An upward trend allows investors to profit from rising asset prices. Selling an asset when it fails to create a higher peak and trough is an effective way to avoid large losses. Trendlines and moving averages are useful tools for identifying and analyzing uptrends. However, the confirmation of an uptrend depends on the price making higher swing highs and higher swing lows.
Moving averages can also indicate an uptrend. When the price is above the moving average, the trend is considered up. Conversely, when the price drops below the moving average, it may no longer be in an uptrend.
However, it’s important to note that in some cases, the trend direction may be hard to determine, and traders may choose to wait until an uptrend is clearly visible.
Trading Uptrends
There are several techniques for analyzing and trading uptrends. Price action analysis, trendlines, and technical indicators are commonly used.
Price action traders may choose to buy during a pullback or when the price attempts to make a new swing high. The moves lower, called pullbacks, provide an opportunity to buy at a lower price and profit from the subsequent price rise.
Some trend traders prefer to wait for a definitive rise in price before buying. They may wait for the price to move above a short-term resistance level or for a technical indicator to signal a buy.
Specific entry criteria, such as buying near anticipated support levels or waiting for a price breakout, can be used to control risk. Stop-loss orders are typically placed below recent swing lows.
It’s important to remember that past performance does not guarantee future price movement.
Exiting a Profitable Uptrend Strategy
There are various ways to exit a profitable trade. These include observing a lower swing low, a bearish turn in technical indicators, a break in trendlines or moving averages, or hitting a trailing stop loss.
- Lower Swing Low: Exiting when the price reaches a low point below the previous low indicates a potential shift in market sentiment.
- Technical Indicator Turns Bearish: Negative signals from indicators like RSI or MACD may suggest overbought conditions or weakening momentum.
- Trendline or Moving Average Break: A breach in a trendline or moving average may signal a reversal and a change in market sentiment.
- Trailing Stop Loss: A trailing stop-loss is an order that adjusts with the price movement to lock in profits and minimize losses.
Example of Analyzing and Trading an Uptrend
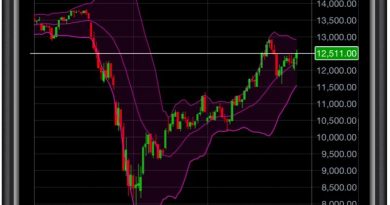
An example of potential trades using support or resistance levels on increasing volume is shown in the chart of Meta (formerly Facebook) Inc. Waiting for volume to increase before entering a trade is important to avoid entering too early or at suboptimal times. Trades occurring during pullbacks or near support are marked where the price briefly falls below the moving average before climbing again.
These are general entry strategies for demonstration purposes only. Trades were avoided during a downtrend.
Uptrends and Common Chart Patterns
Two patterns commonly found in uptrends are ascending triangles and bullish flags.
Ascending Triangles
An ascending triangle consists of a horizontal resistance line and an ascending trendline. The consolidation within the triangle reflects the balance between bullish and bearish forces. The breakout from an ascending triangle occurs when the price moves above the horizontal resistance line, signifying a shift in power in favor of buyers.
Bullish Flags
Bullish flags indicate a consolidation period within a strong upward movement. After a sharp price increase, a rectangular-shaped flag pattern forms. A breakout above the upper boundary of the flag confirms the continuation of the uptrend.
Limitations of Uptrends in Technical Analysis
Uptrends can be disrupted by sudden spikes in market volatility or unforeseen events. Technical analysis may produce false signals and often neglects fundamental factors that can influence markets. Identifying an uptrend can also be subjective, and different traders may draw trendlines and interpret trends in various ways.
Trading Psychology of Uptrends
During uptrends, positive sentiment prevails, but traders should avoid letting market sentiment dictate their actions. Common psychological challenges during uptrends include FOMO and overconfidence. Traders should be vigilant with their strategy and adapt to changing conditions based on their knowledge.
Key Characteristics of an Uptrend on a Price Chart
Key characteristics of an uptrend include higher highs and higher lows, indicating sustained upward momentum and resilience during retracements.
Identifying an Uptrend Using Trendlines
Trendlines are essential tools for identifying uptrends. Traders draw trendlines by connecting successive lows in an uptrend.
Using Support and Resistance Levels in Uptrend Analysis
Support and resistance levels play a crucial role in uptrend analysis. Previous resistance levels often become new support levels as the price continues to rise.
Significance of Higher Highs and Higher Lows in an Uptrend
Higher highs and higher lows indicate a strong and consistent upward movement. Higher highs reflect sustained buying pressure, while higher lows demonstrate the resilience of the uptrend during retracements.
The Bottom Line
Uptrends signify a sustained upward movement in a security’s price, characterized by higher highs and higher lows on a price chart. Traders typically use trendlines, moving averages, and momentum indicators in their analysis. Understanding and capitalizing on uptrends can be profitable for traders.